Job Failure Reference
This page catalogs known job failure scenarios observed across the runner pod lifecycle, with verified GitHub Actions run examples for each case. Use it for troubleshooting or to understand expected behavior.
Expected pod state transitions for a successful run: Pending → Running → Succeeded (terminal — pod is then removed)
Normal Flow
Manually trigger the correct workflow with a valid, pullable image. Pod transitions: Pending → Running → Succeeded.
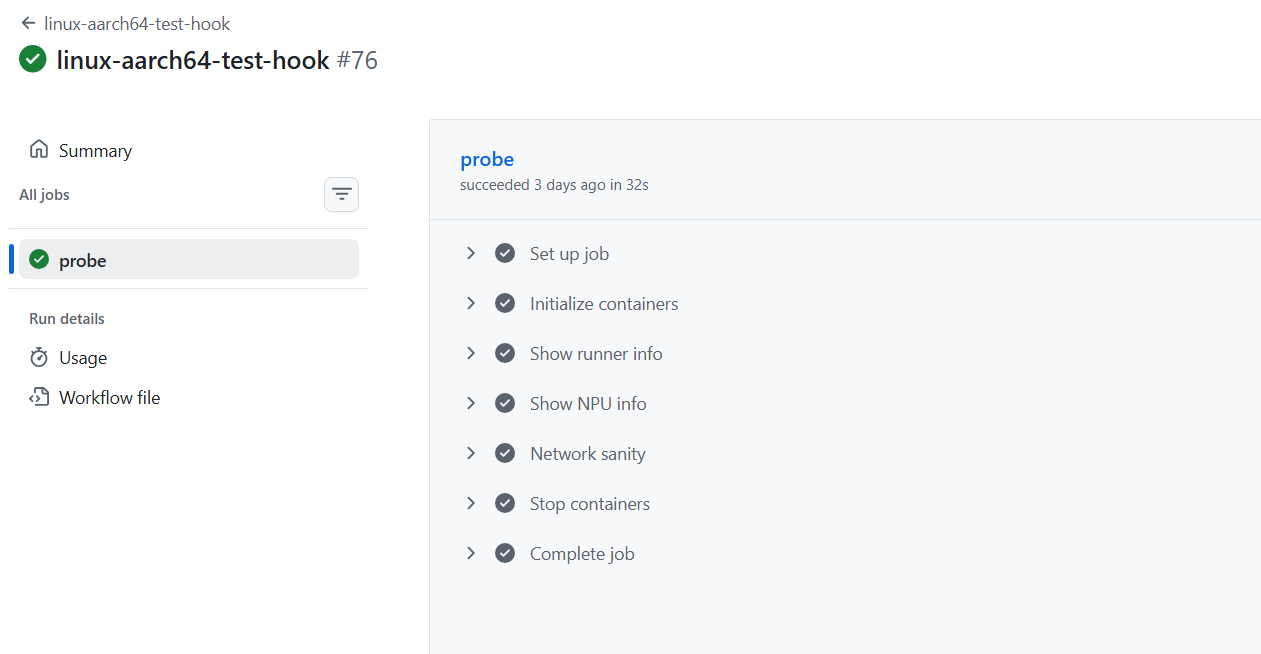
Ref: linux-aarch64-test-hook · ascend-gha-runners/add-node-check@22e524c
Pending Phase
Image Errors
InvalidImageName
Invalid image name format.
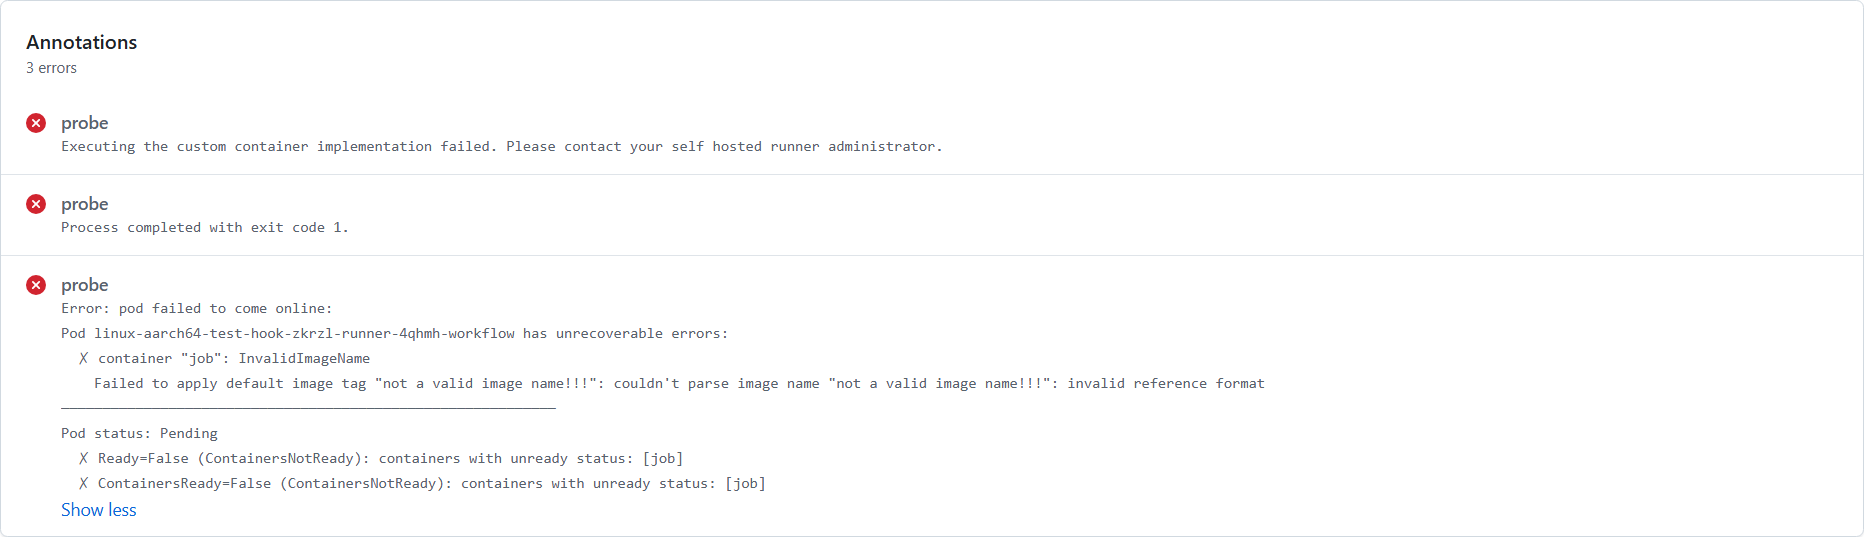
Ref: linux-aarch64-test-hook_invalid-image-name · ascend-gha-runners/add-node-check@22e524c
ErrImagePull
Image does not exist.
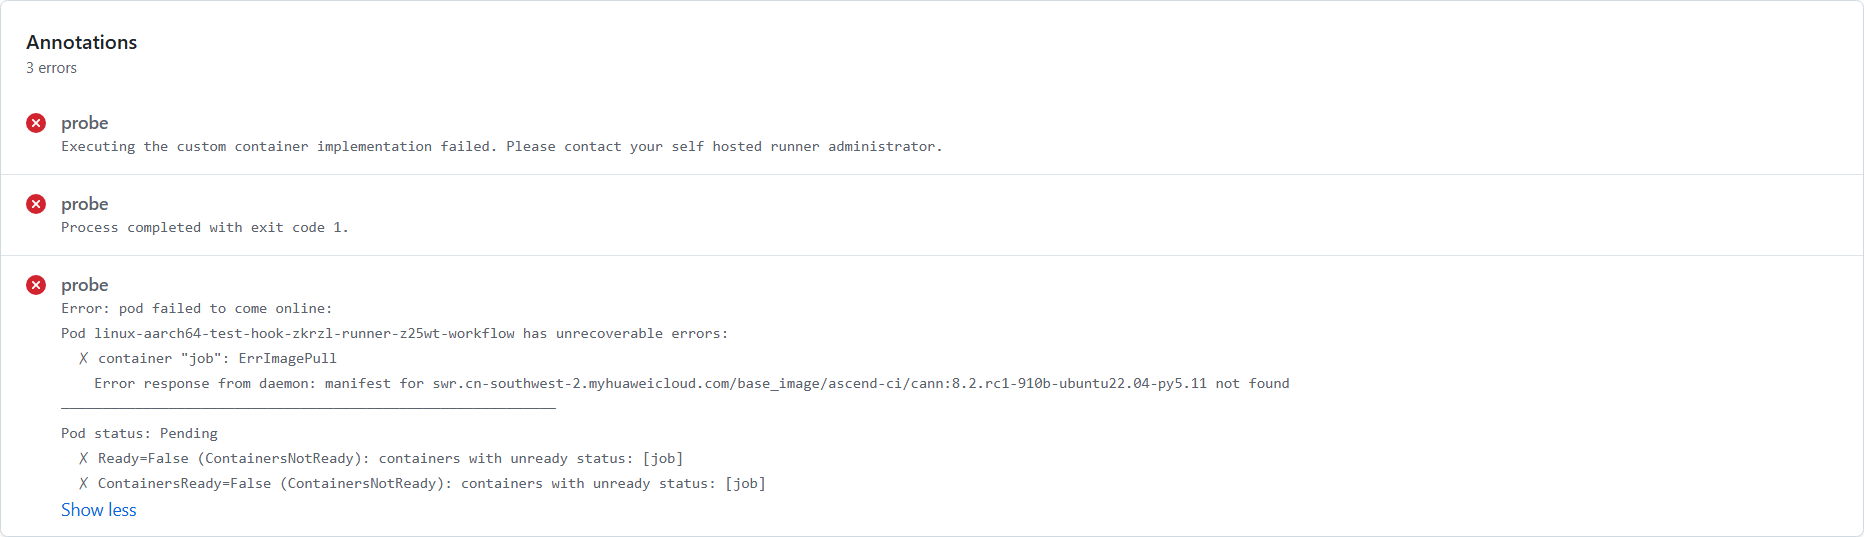
Ref: linux-aarch64-test-hook_err-image-pull · ascend-gha-runners/add-node-check@22e524c
ErrImagePull: 401 Unauthorized After Registry Change
Image pulls fail with 401 Unauthorized after the registry address was changed (e.g., swr.<region-a> → swr.<region-b>) — the runner's existing secret has no pull permission for the new registry. Before switching registries, confirm with the infrastructure team whether the new registry is public or credentials exist, or make the image public.
Ref: #250
Image not synced to SWR (not found)
Build / image pull fails with failed to resolve source metadata ... not found (issue #223). After the upstream image source changed (e.g., quay.io/ascend → quay.io/atlas-ci), the SWR redirect repository address was not updated. Check the source→SWR mapping in sync-tools image-sync.json, update the SWR redirect address accordingly, then re-run.
Ref: #223
Image pull slow (Initialize containers stuck)
The pod sits at Initialize containers for a long time: the image has no cache on a node of the target architecture and pulls very slowly (issue #271); sometimes container initialization simply hangs (issue #121). This happens when the image address is not cached on the CI side (e.g., a direct ghcr.io pull). Switch to a domestic accelerator mirror (e.g., ghcr.nju.edu.cn), or ask the CI side to sync the image to the SWR mirror via sync-tools and use that image, then re-run.
Container Creation Errors
CreateContainerConfigError
Referencing a non-existent Secret.
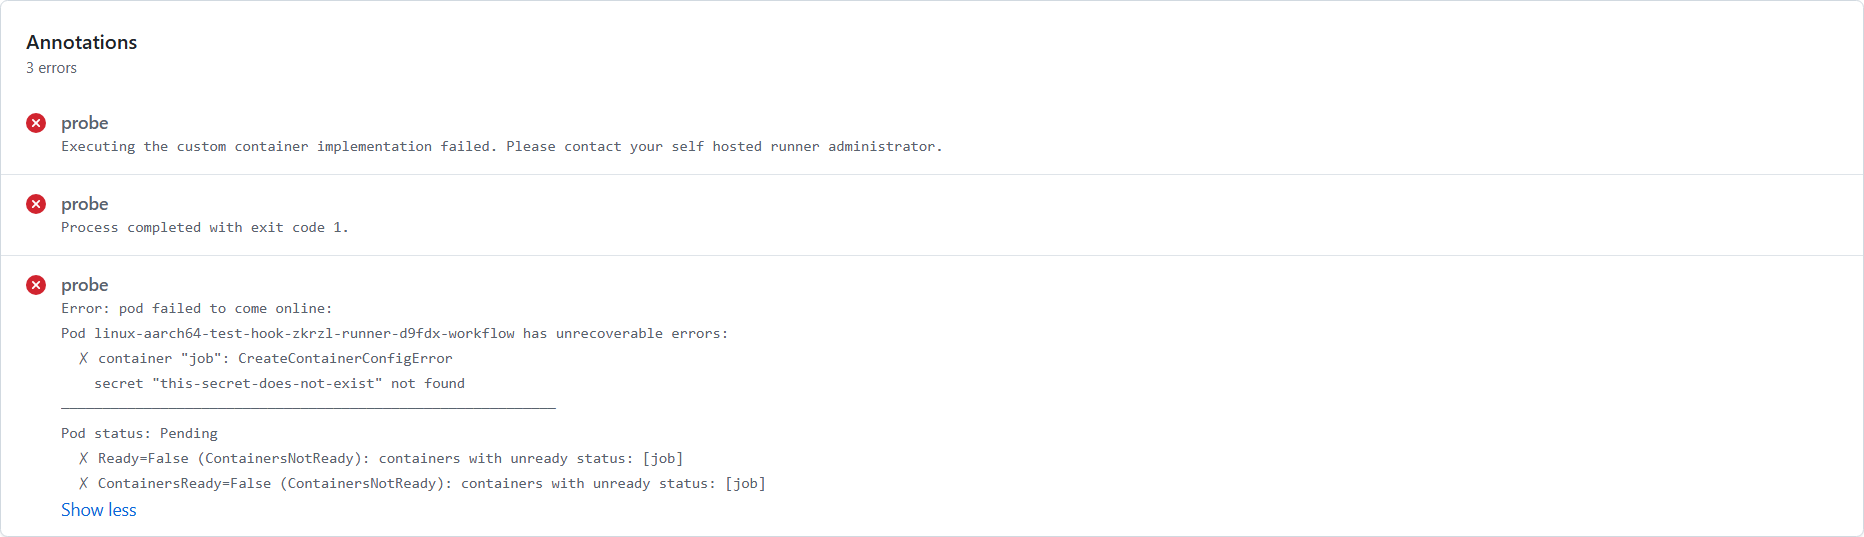
Ref: linux-aarch64-test-hook · ascend-gha-runners/add-node-check@22e524c
Container dies immediately (postStart hook exit 137)
The workflow pod dies on startup with container "job": Error (exit code 137) — the "Likely OOM" hint is misleading — while kubelet logs Failed to execute PostStartHook: ... failed to drain exec process io in 2s (issue #257). The image's /bin/sh is dash, and npu-smi info &> /dev/null in the hook uses the bash &> operator; dash parses it as "run in background" instead of a redirection, so npu-smi inherits the exec stdout/stderr pipe. containerd has a hard-coded 2s drain timeout, so the hook is judged failed and kubelet SIGKILLs the container (hence exit 137, not OOM). Fix: use the POSIX form > /dev/null 2>&1, avoid background / long-running processes in postStart, and move the NPU readiness wait out of postStart into the test setup script.
Ref: #257
novolume mode failures / extra time
Several symptoms appear under novolume mode: the copy + hash check after each checkout step fails and retries repeatedly (PostCheckout takes ~11min, issue #144); a uses: local / composite action can't find its script inside the container (can't open file ... No such file or directory, issue #146); Initialize containers fails (ARC 0.13.0 + novolume, issue #42 / #44); and each step takes ~30s extra (upstream runner-container-hooks#274, issue #66). Root cause is upstream runner-container-hooks novolume defects — the Job Pod volume path is /__w while the runner side uses /home/runner/_work; runScriptStep doesn't sync _actions/; execCpFromPod's tar extract doesn't clear the target dir and the status callback resolves too early, so hash validation always fails. Rewrite uses: steps as run:, remove redundant setup steps, and upgrade ARC / runner-container-hooks to a version containing the fix.
Scheduling Errors
FailedScheduling (nodeSelector)
nodeSelector mismatch — no node satisfies the label constraints.
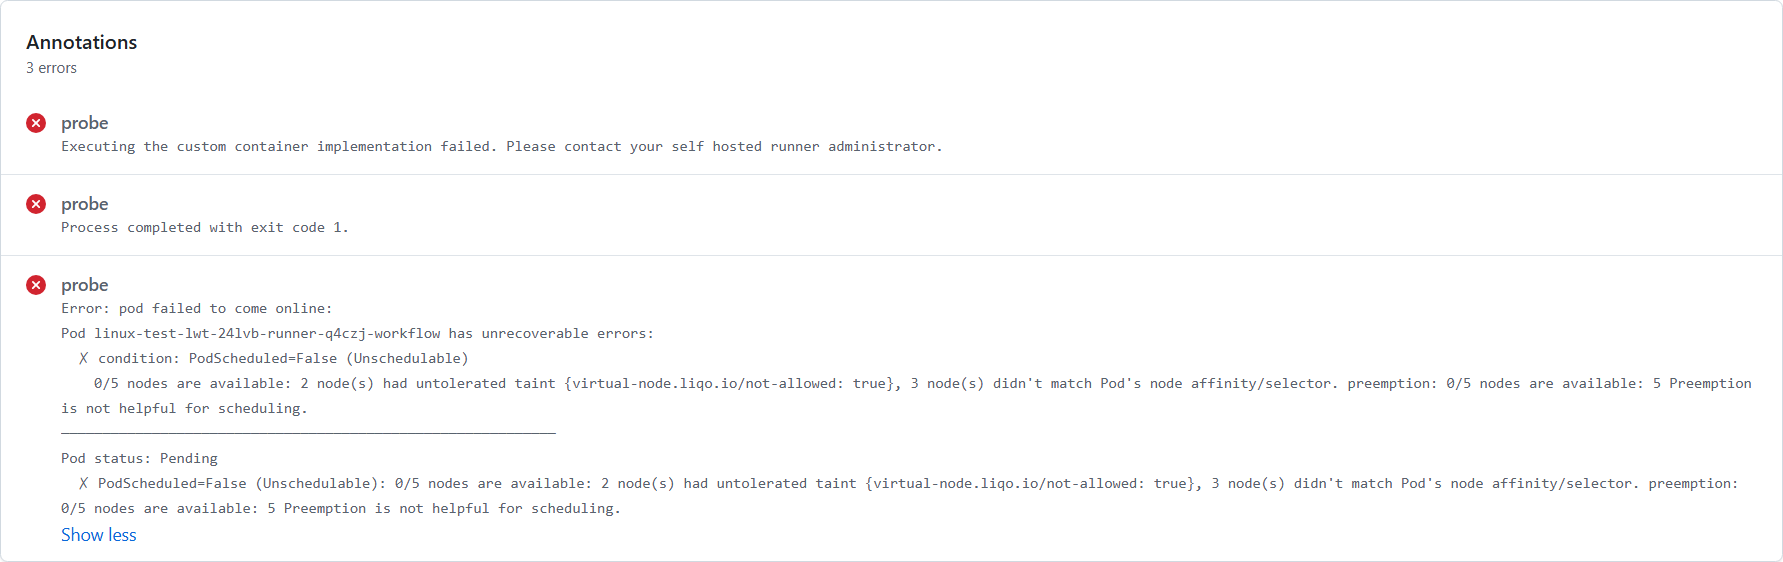
Ref: linux-aarch64-test-hook · ascend-gha-runners/add-node-check@b4b3d9d
FailedScheduling (resource limit)
Resource request exceeds node limit (422 scenario); or the pod is rejected outright by the node (OutOfcpu): Pod was rejected: Node didn't have enough resource: cpu, requested: 8000, used: 29895, capacity: 31850 (issue #248). The requested NPU cards / resources exceed the node limit for that label, or the node's CPU is already saturated by other workloads so the new pod's CPU request can't be met (issue #248). Lower the requested cards / resources or switch to a larger label; for OutOfcpu, wait for the node to free up or use another label; check labels and machine specs in Cluster.
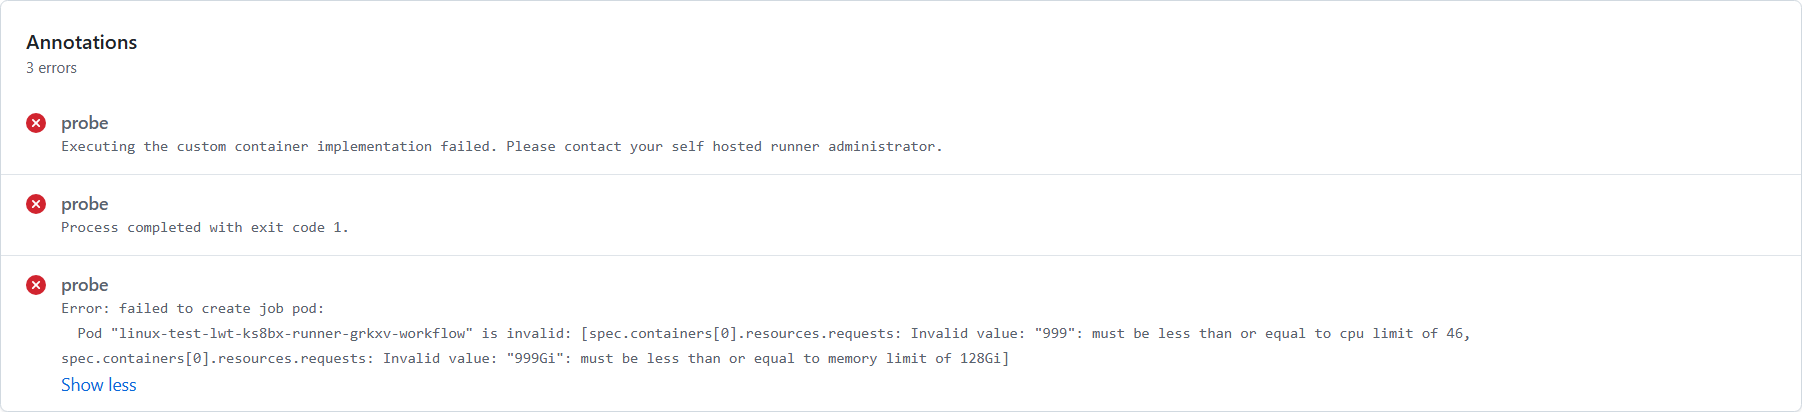
Ref: linux-aarch64-test-hook · ascend-gha-runners/add-node-check@b4b3d9d #248
FailedBinding
PVC does not exist.
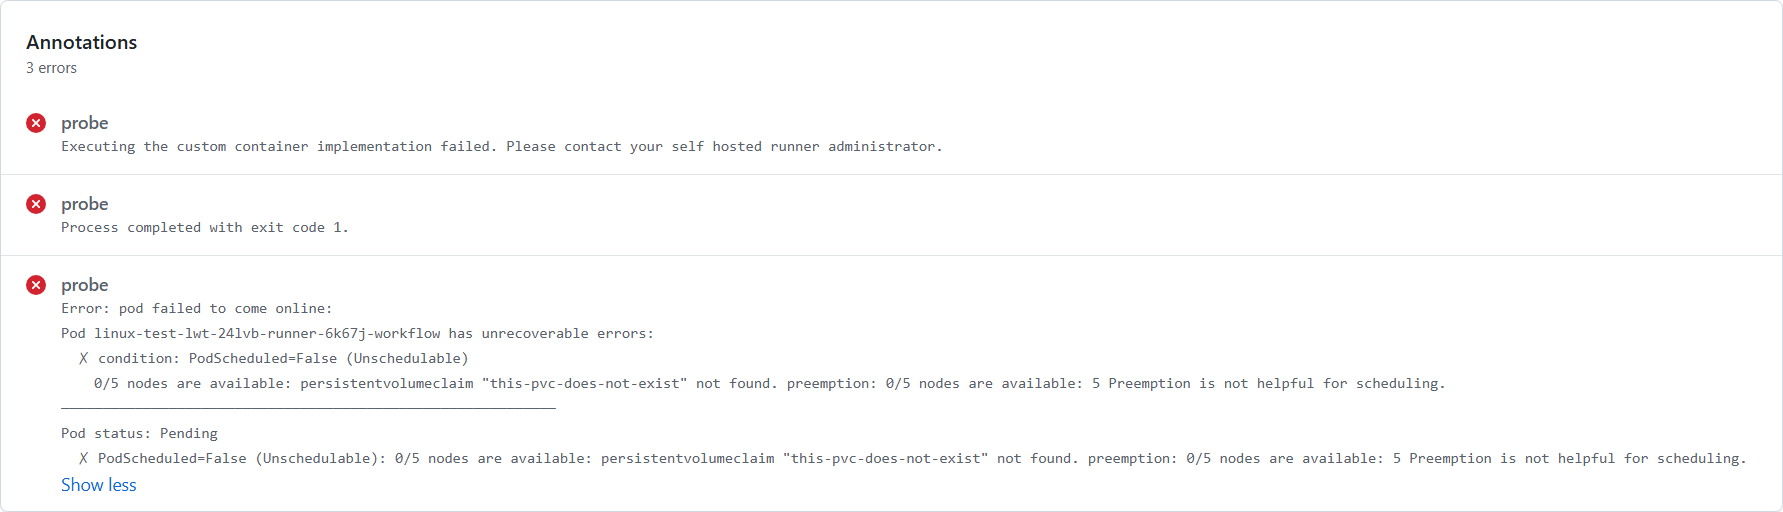
Ref: linux-aarch64-test-hook · ascend-gha-runners/add-node-check@b4b3d9d
Scheduled onto an arch-mismatched node
The workflow pod fails to init / run — a lint job reports ModuleNotFoundError: No module named 'rpds.rpds' (dependency unavailable on aarch64, issue #40 / #46), or an arm image can't initialize on an amd64 CPU runner (issue #50). The workflow pod isn't restricted to a node, so a CPU / lint job lands on an NPU (aarch64) node, or the image architecture doesn't match the node. Confirm the node architecture the job actually landed on, pin CPU / lint jobs to a matching amd64 label + nodeSelector, and use an image with a matching architecture.
Virtual Node Offloading Errors
Liqo namespace not offloaded (task stuck)
Task stays Waiting, the runner pod is in OffloadingBackOff and never starts on the target remote cluster; NamespaceOffloading stays in CreationLoopBackOff (issue #205). A pre-existing namespace on the remote cluster lacks the Liqo takeover markers, so Liqo refuses to reflect pods (ReflectionDisabled). Add the same markers used by other clusters (label liqo.io/remote-cluster-id, annotations liqo.io/managed-by-namespace-map / liqo.io/original-name) — non-destructive, no changes to PVC/SA/namespace content — then it recovers; pin the markers into the deployment repo kustomization to avoid drift.
Ref: #205
Running Phase
Container Runtime Errors
Container crash
Exit non-zero — container exits immediately after start.
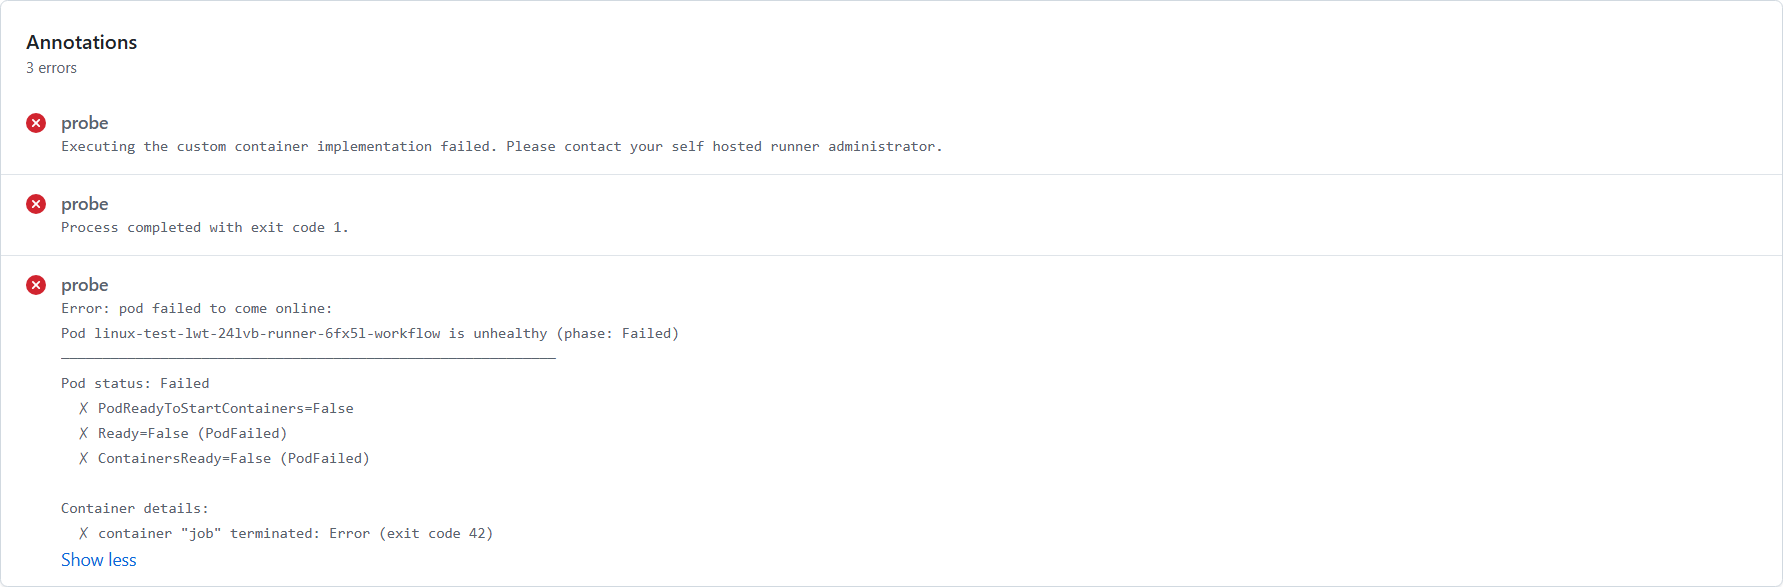
Ref: linux-aarch64-test-hook · ascend-gha-runners/add-node-check@b4b3d9d
OOMKilled
Out of memory — container killed by the kernel OOM killer.
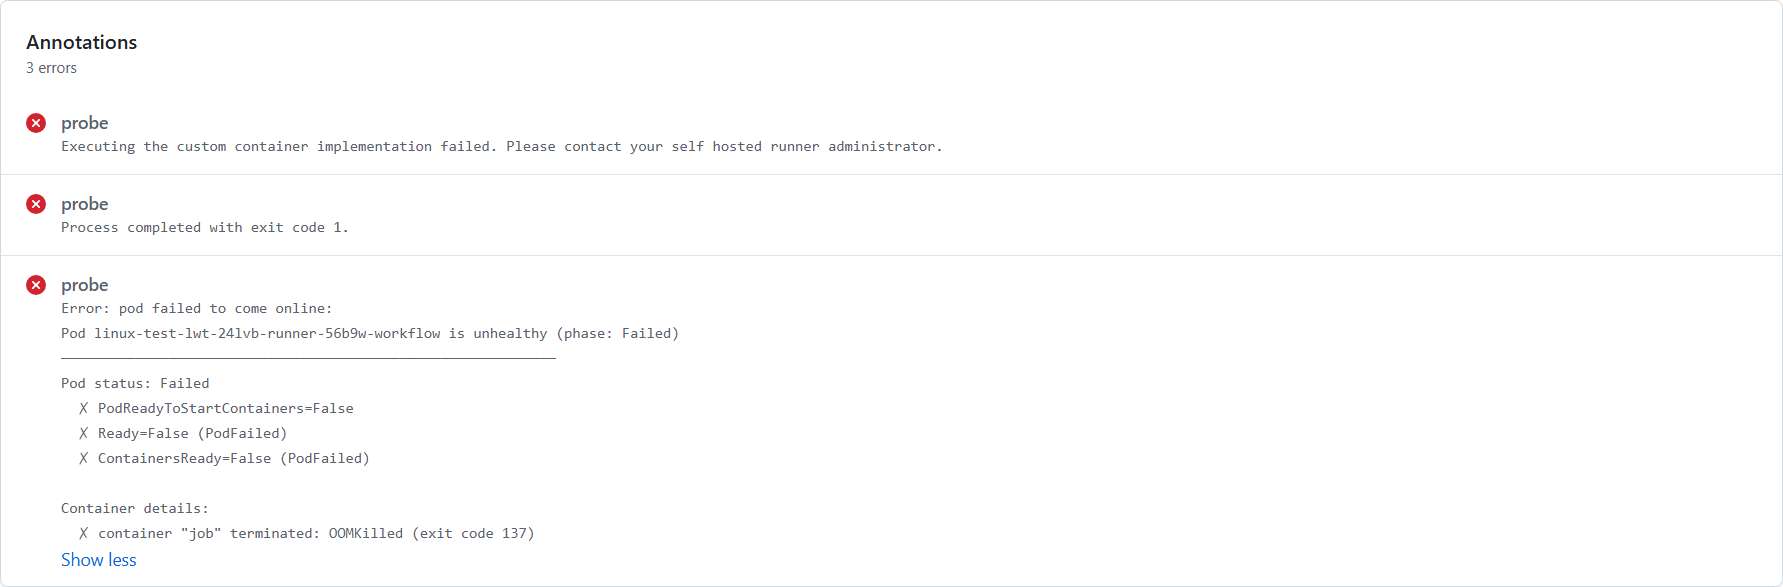
Ref: linux-aarch64-test-hook · ascend-gha-runners/add-node-check@b4b3d9d
Host memory exhausted (aclrtMallocHostWithCfg 207001)
The process exits in the Running phase with torch.OutOfMemoryError: allocate_host_memory_slowpath, backed by aclrtMallocHostWithCfg ... error code is 207001 and Memory_Allocation_Failure(EL0004) (issues #264 / #272). This is not Kubernetes OOMKilled (the container limit was not exceeded) — the node's host memory is insufficient. The test case's host-side allocation (pinned memory, KV cache, etc.) exceeds available node memory: #272 had high concurrency and an oversized hicache size; #264 was an under-resourced a2b3-8 node. First tell host memory (207001) apart from container OOMKilled; reduce the test case's concurrency / hicache size (#272 was fixed this way); if resources are still short, use a larger label (#264 switched to a3-800i-8 and raised the memory limit); then re-run.
/dev/shm exhausted
Multimodal test cases (e.g., qwen2.5-VL) hit /dev/shm OOM on small-card runners (e.g., 2 cards) and only pass on a larger flavor (issue #27). The runner pod's /dev/shm is too small by default. The platform has raised it to 1Gi; if still insufficient, use a label with a larger /dev/shm or reduce the test case's concurrency / memory usage.
Ref: #27
Workflow Errors
UserScriptError
User script step exited with non-zero code. K8s pod reason: Error. Unlike container crash, the runner container started successfully and workflow steps executed — the failure is in the script logic itself.
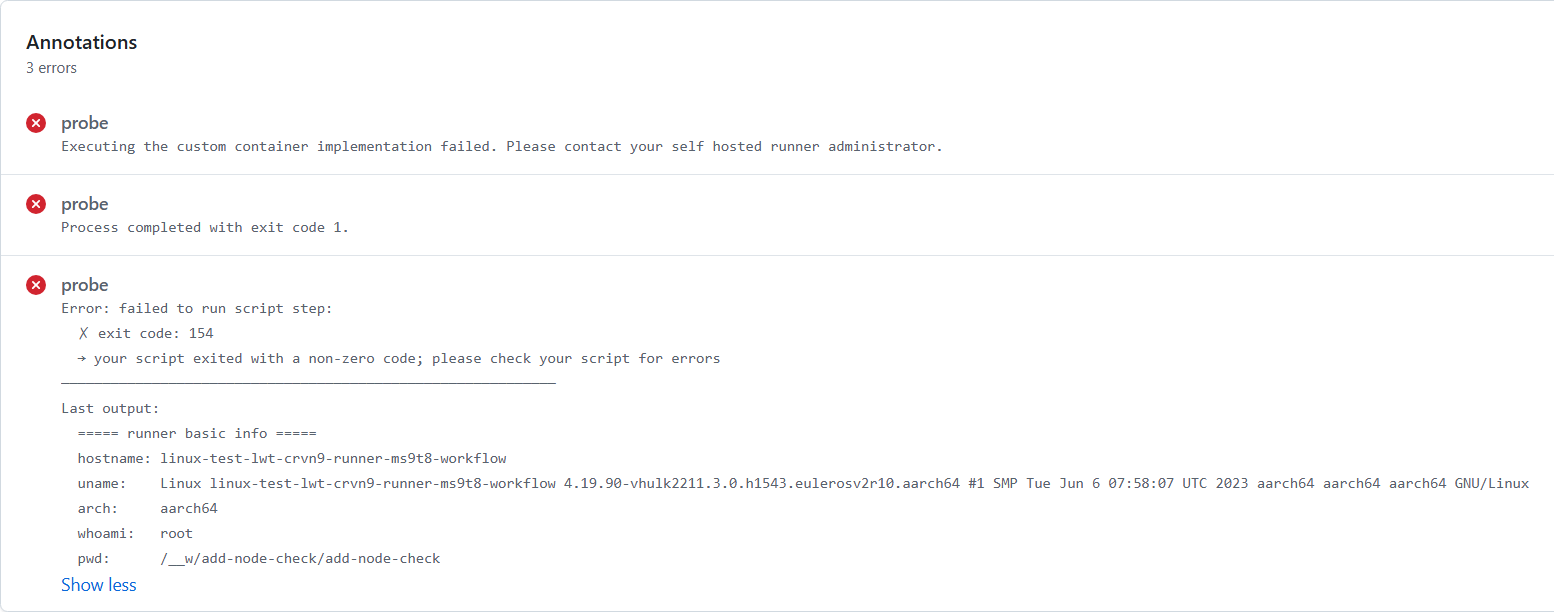
Ref: linux-aarch64-test-hook_user-script-error · ascend-gha-runners/add-node-check@3cd45c8
kubeconfig / secret points to the wrong cluster
kubectl / the client inside the task can't reach the API: dial tcp <internal-ip>:5443: i/o timeout, Unable to connect to the server (issue #293). The kubeconfig in the repository secret points to a non-target cluster (in this case the Hong Kong cluster) — a user-side configuration error. Check whether the kubeconfig's server address in the secret is the target cluster; obtain the correct kubeconfig for the target cluster from the infrastructure team (prefer the internal server address); update the secret and re-run (#293 passed after the update).
Ref: #293
Artifact / log upload failed (whitelist)
Artifact / log upload reports Upload progress stalled, then the container hook fails (Executing the custom container implementation failed, exit code 1) (issue #197). The upload target URL was not added to the network whitelist. Ask the infrastructure team to whitelist the target domain (one-off, persists afterwards), then re-run.
Ref: #197
Install / build OOM (parallelism too high)
During source compile / install, processes are killed en masse and installation fails (suspected OOM, issue #112); after switching the runner label the card count is parsed incorrectly (e.g. a3-800i greedily parsed as 800, issue #247). The build script derives the thread count from a wrong core count (the real per-card CPU is 23, but the script computes 192 and runs at 192×2 concurrency), exceeding what the node can bear; the card-count regex matches greedily. Set the compile thread count explicitly in the CI environment variables instead of relying on the script's auto-computation; fix the regex that parses the card count from the label (e.g. s/.*a3-(800i-)?([0-9]+).*/\2/); and set parallelism according to the node's real CPU.
Dependency cache errors (pypi / rust)
Installing dependencies reports read timeout, Download failed because not enough bytes were received, or HTTP status server error (503) (issues #32 / #98 / #113 / #117); or dependency download takes over 2h (rust dependencies going to the official source, issue #89); or a package hash mismatch: THESE PACKAGES DO NOT MATCH THE HASHES FROM THE REQUIREMENTS FILE (issue #208); or cargo fails pulling crates.io through the proxy with a timeout (issue #274). The pypi cache service (nginx) upstreams to Huawei Cloud — when sync is delayed or rate-limited the cache itself can't get packages; cache misses spill over to the official source; keepalive and proxy_read_timeout are misconfigured; and rust-like dependencies bypass the cache and the domestic network can't reach the official source. A hash mismatch usually means the mirror site hasn't synced or the cache service version is old (issue #208 traced it to the download-r2 mirror not being synced and an outdated nginx); crates.io proxy timeouts are a proxy stability issue (issue #274). Determine whether the error comes from the cache service or has already spilled to the official source; for a hash mismatch ask the CI side to refresh the mirror / update the cache service and don't keep retrying (issue #208); for cargo / crates.io timeouts re-run failed jobs first and report repeated timeouts to the CI side (issue #274); tune the cache service (disable keepalive, raise proxy_read_timeout, shorten lock lifetime); switch the forwarding mirror to a CDN-accelerated domain; and point community dependencies (e.g. rust) at a domestic mirror.
Abnormally slow steps (model load / checkout)
Loading a 70G model takes about 1100s (issue #13); checkout is occasionally very slow (issue #202). Storage bandwidth is insufficient (issue #13 reached 1GB/s after moving the model to local storage); checkout's network traffic goes out the same IP used by model downloads and gets saturated (issue #202). Check whether model-load / checkout times are clearly abnormal; upgrade storage / split the traffic (keep checkout and model downloads off the same egress); and contact the infrastructure team for infrastructure-level issues.
Build Errors
BuildKit cache corrupt (parent snapshot not found)
Image build reports ERROR: failed to solve: failed to compute cache key: parent snapshot sha256:... does not exist: not found, and the same script fails on only some agents / machines (issue #291). The agent's local buildx cache layer chain is corrupted (an interrupted historical build or a full disk truncated the cache export), so every build fails once the parent snapshot is gone; after clearing the cache, the cold build also exposed hidden issues such as an invalid cache-service address and security groups not allowing traffic. Re-run to confirm the failure is pinned to certain agents / machines; ask the CI side to clear and rebuild that agent's buildx cache; if the cold build exposes an invalid cache-service address / blocked network, fix that too; then re-run.
Ref: #291
Task Hang / Timeout
Task hang / timeout (engine process stuck)
Task runs for hours with no output and is cancelled on timeout; the pod shows Running but logs stop updating (issue #216: cancelled after a 4h5m timeout). The vLLM v1 engine core crashed / deadlocked mid streaming inference (16-card worker with speculative decoding + DP×TP + expert parallel), so the output queue gets neither tokens nor a proper finish and the client blocks forever on await q.get(). The Running pod only means the runner container is alive — it is a business-code / test-case issue. Check whether the log stack ends at async_llm.py q.get() or output_processor.py raise output; reproduce with the launch params; if you don't need to keep waiting, cancel from the GitHub Actions page and re-run.
Ref: #216
Communication Errors
HCCL Port Already Bound
Multi-node job fails in Running phase with Communication_Error_Bind_IP_Port(EI0019): ... The IP address ... and port 60000 have already been bound. — the port is occupied by another process or the service process was started multiple times on one device. Check port occupancy; adjust via HCCL_IF_BASE_PORT or sysctl -w net.ipv4.ip_local_reserved_ports; fix the test case and re-run.
Ref: #219
Environment Errors
Model Cache Missing / Incomplete
Running phase fails with model-cache errors in three forms: incomplete — huggingface_hub.errors.IncompleteSnapshotError: The cached snapshot ... is incomplete: N file(s) are missing (issue #242); missing — huggingface_hub.errors.LocalEntryNotFoundError: Cannot find an appropriate cached snapshot folder ... outgoing traffic has been disabled (issue #220), or a missing shard (issue #200); or version-incompatible — loading weights raises KeyError: 'wkv.weight_offset' and similar missing keys (issue #268), usually because a stale older cache doesn't match the current code's index structure. The cluster the task actually landed on has no such model cache, an incomplete one, or an old-version one, and local_files_only=True prevents online completion. Identify the missing model/files from the error, verify the cache on that cluster, for KeyError-style version mismatches check that the cache version matches the current code and clear the old cache then re-download (issue #268 recovered this way), ask the infrastructure team to complete / re-download missing caches, then re-trigger the workflow.
Platform / Cluster Errors
Node Resource Occupied
NPU occupied by an external process / out-of-band container
After the runner is scheduled, the task fails during init or run — reporting dcmi model initialized failed, because the device is used. ret is -8020 (issues #11 / #47) or davinci[davinci0] already in use (issue #43); or tests randomly hit NPU OOM / startup reports HBM not released (issues #101 / #225 / #231). Someone occupies the NPU on the node with bare docker / a local process; the device-plugin's allocation ledger only tracks k8s pods and is unaware of out-of-band occupation, so it still assigns the card to CI tasks. Mixing the default-scheduler and volcano on the same cluster also produces "card already occupied" (issue #43). When npu-smi inside the pod shows no occupying process, check the real holder of /dev/davinci* on the host (hostPID + nsenter -t 1 -m); clean up the out-of-band container / process; tighten the machine-reclamation process (confirm no container leftovers before handing back); standardize on the volcano scheduler cluster-wide; and add fail-fast on the test side (check available HBM before running a case and report an environment error below the threshold).
Storage Errors
Shared disk out of space / stale lock files
Reports OSError: [Errno 122] Disk quota exceeded (issues #191 / #221) or failed to create temp dir ... no space left on device (issue #252); or OSError: [Errno 116] Stale file handle (issue #72), with multi-card tasks stuck forever at engine init (FileBaton stale lock, logs stop updating, issue #187). The shared / cache disk quota or space is exhausted (a new cluster didn't reserve model-cache space; the a5 image is larger and the buildkit retention threshold is too low); and the shared storage's "file exists means locked" mechanism (torch FileBaton, modelscope filelock) leaves a stale lock file after the holding process is SIGKILLed, with no timeout / stale detection. Distinguish quota (Errno 122 / EDQUOT) from disk full (Errno 28 / ENOSPC); clean the cache / expand the shared disk and reserve model-cache space for new clusters; adjust the buildkit retention threshold and add disk alerts; when a task hangs, use py-spy to dump the stack and confirm whether it is stuck in wait() in torch/utils/file_baton.py, then delete the stale lock (find /root/.cache/torch_extensions -name lock -mmin +60 -delete); and add stale-lock cleanup to the CI startup step while precompiling the relevant C++ extensions into the image long-term.
Control Plane
Control plane API transient outage (ECONNREFUSED / 403 during cleanup)
The job fails suddenly during cleanup with FetchError: request to https://<internal-ip>/apis/authorization.k8s.io/v1/selfsubjectaccessreviews failed, reason: connect ECONNREFUSED, or the same request returns 403 forbidden; multiple PRs / repositories go red in the same time window and a re-run passes (issue #274). During the managed apiserver backend rotation window the forwarding rules weren't switched atomically and the new instance's RBAC cache hadn't finished syncing; the container hook's pre-flight request is single-shot with no retry, amplifying a sub-second blip into a job failure. Confirm whether several CI runs failed in the same window and whether a re-run passes; just re-run failed jobs; do not change RBAC / ServiceAccount permissions because of this; report repeated occurrences to the CI side (hook pre-flight retries are in progress).
Ref: #274
Node Abnormalities
Node abnormal after maintenance (shared disk not mounted / whitelist missing)
After a node is powered down and back up / maintained, two problems appear: CI can't find the model, and after the mount is restored the node can't reach api.github.com so it receives no jobs (issue #284). The shared disk wasn't remounted after maintenance, and the lab firewall whitelist doesn't allow the domains CI needs. Check whether the node's shared disk is mounted (CI can't find the model); confirm the node's outbound whitelist to GitHub / dependency sources is complete; restore the mount and complete the whitelist, then re-run.
Ref: #284
Node DNS resolution failure / clock skew
Runner logs report Could not resolve host: pipelinesghubeus11.actions.githubusercontent.com / Socket Error: TryAgain (issues #48 / #88), and the task queues forever without executing; or the install phase reports No module named 'deep_ep' (torch_npu download failed, issue #49); or the runner can't register and ARC fails to authenticate to GitHub (issue #99); or the task can't resolve a cluster service: Could not resolve host: rayjob-submitter.ci-system.svc.cluster.local (issue #270). The node's DNS resolver plugin is faulty, so the runner pod can't reach GitHub central services / download dependencies; or the node has no NTP configured and clock skew causes authentication failures; or the target cluster doesn't deploy the required service / the service config doesn't match the cluster (issue #270: the cluster lacked the ray service, and after the disk path changed the ray service still pointed at the old path, reporting FailedMount ... hostPath type check failed). Verify resolution with curl -v / nslookup inside the runner pod and check whether the node clock is skewed; if a service domain fails to resolve, confirm the target cluster actually deploys that service and that the node paths in its config match the cluster (issue #270 recovered after fixing the ray config); confirm it is a node-level fault; replace the node; and investigate / fix the DNS plugin or configure NTP.
Node hardware failure (NPU hang / NotReady)
The node hard-hangs entirely and is force-reset out-of-band by the cloud platform about 5 minutes later; pods are evicted and the CI task fails; NodeNotReady; and after reboot the NPU PCIe I/O error persists (issue #152). The Ascend NPU subsystem failed (e.g. ACLGraph capture on a 310P adds load to an already-abnormal NPU, triggering a full-machine hard hang). Confirm from node logs whether it is a full-machine hard hang + out-of-band reset; the node needs a hardware-level NPU reset and a reboot usually doesn't help; check whether the same model in the same cluster is similarly abnormal; add a pre-flight NPU health check in CI and skip or reschedule to another node; and report to Huawei to investigate firmware / hardware.
Ref: #152
Elastic Scaling
Elastic scale-out failed / elastic node unhealthy
Pods stay Pending for a long time but Karpenter doesn't scale out; after the NodePool is set NodeRegistrationHealthy=False it stops retrying; or it reports no stock (issue #226); and the runner template hardcodes nodeName to bypass the scheduler, so the pod goes straight to phase: Failed when the node is full (issue #255). ① The Karpenter fork's unhealthy flag has no auto-recovery; ② a single model + single-AZ subnet has no fault tolerance; ③ billing / account flapping; ④ the deployment config hardcodes nodeName. Clear the NodePool's NodeRegistrationHealthy=False; keep at least 2 same-tier models in the list and attach multiple AZ subnets to the NodeClass; remove the nodeName hard binding in favor of nodeSelector: kubernetes.io/arch; and alert on NodeRegistrationHealthy=False and Pending timeouts.
Runner Management
Runner slots occupied by stuck EphemeralRunners
The task stays at Waiting for a runner to pick up this job for a long time and the runner set has no free slot; kubectl get ephemeralrunner shows EphemeralRunners whose job already ended still stuck in Running; and failed ERs with TooManyPodFailures are not cleaned up (issues #15 / #39 / #41 / #53 / #54 / #56 / #88). Root cause (per issue #53): ARC upstream #4148 — after node drain / pod termination the GitHub-side runner is gone, but the K8s EphemeralRunner stays Running, filling the concurrency slots and causing a scheduling jam; it recurs more often after introducing Liqo virtual nodes. Check whether EphemeralRunners have a stale Running and manually delete the zombie ERs to recover; upgrade ARC to 0.13.1 or above; alert on EphemeralRunners over 12h; and use a scheduled script to clean up runners that don't exit normally.
Runner version too old (GitHub raised the minimum version)
After GitHub announces a raised minimum version for self-hosted runners, runners can't register / workflows don't start (issues #61 / #116). GitHub Actions raised the minimum runner version (e.g. 2.329.0, 2.333.0) and the platform-side runner image is too old. Track the minimum runner version required in the GitHub changelog; replace / upgrade all runner versions before GitHub's deadline; and set up a regular upgrade mechanism.
Support
If you encounter an issue not listed on this page, please create a discussion or contact the infrastructure team.
Document version: v2.4 Last updated: 2026-10-22